
When you hear fund managers talk about alternative investment terms Africa investors deal with, it can feel like another language. But these words aren’t just jargon, they shape every deal, contract, and portfolio decision you’ll ever make. And with alternative investments flooding into Africa at record levels, foreign investment jumped 75% to $97 billion in 2024, while the alternative lending market is growing 31.3% each year, understanding the language is no longer optional. Yet, many African investors are missing opportunities simply because they don’t understand the language.
When fund managers start throwing around terms like “hurdle rate,” “waterfall structure,” and “DPI,” the conversation can quickly become incomprehensible. These alternative investment terms African investors encounter aren’t just jargon – they’re the building blocks of every investment decision you’ll make.
Building on our previous coverage of why alternatives matter for African investors and which opportunities to consider, this glossary tackles the terminology that separates confident investors from confused ones. Because understanding these key concepts and definitions isn’t just about sounding smart in meetings, it’s about protecting your capital and maximizing returns in a rapidly evolving market.
Why This Alternative Investment Terms Could Save Your Portfolio
Understanding alternative investment terminology isn’t academic exercise, it’s financial survival. Consider this sobering reality: African private equity funds typically report median net IRRs around 5%, significantly lower than the 14% median seen in developed markets. When the performance gap is already challenging, the last thing any investor needs is to miss opportunities due to language barriers.
But here’s what most glossaries miss: the terms that matter most for African investors aren’t the same ones that matter in London or New York. Currency hedging costs, for instance, can destroy returns in ways that traditional metrics don’t capture.
Case Study :In 2023, a group of Nigerian HNW investors committed $50 million to a “USD-denominated” infrastructure fund with “15% target IRR.” The term sheet looked impressive – until they realized the fund’s underlying assets generated revenue in local currencies while expenses (management fees, leverage costs) remained in USD. When the naira depreciated 40%, their effective returns turned negative despite the fund hitting its IRR targets. The term “currency mismatch” wasn’t even mentioned in the original pitch.
The biggest risk African investors face isn’t market volatility or currency fluctuation, it’s signing documents they don’t fully understand. In a region where information asymmetry already favors institutions, retail and emerging investors can’t afford to operate at a linguistic disadvantage.
Fund Types and Structures
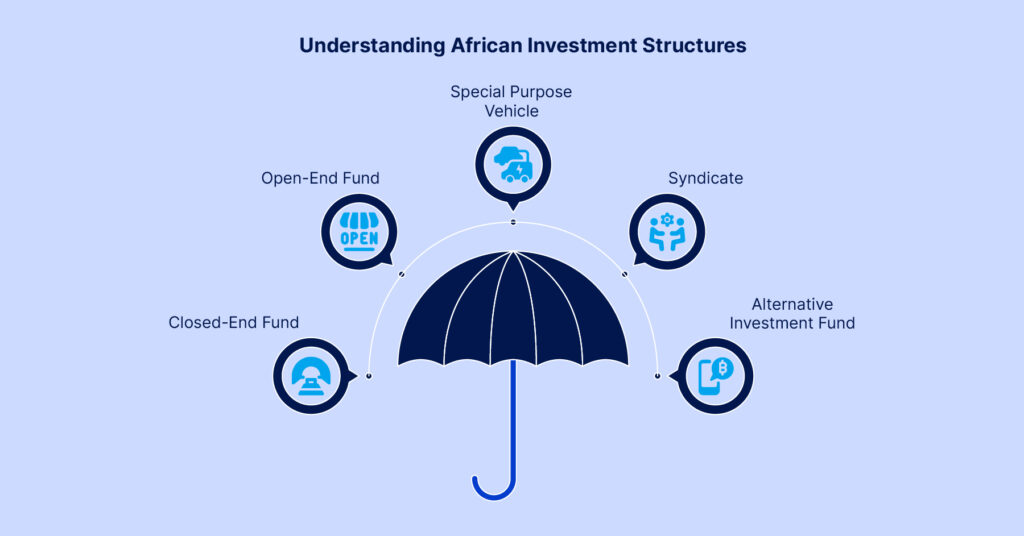
Closed-End Fund A fund that raises capital during a specific period, then closes permanently to new investors. Most African private equity and venture capital funds operate this way. They fundraise for 18-24 months, then close forever. Think university enrollment: once the class starts, no late registrations.
Open-End Fund Funds that allow investors to enter or exit at regular intervals, typically monthly or quarterly. Some African hedge funds and liquid alternative strategies use this structure. The trade-off: usually lower returns but more flexibility than closed-end funds.
Special Purpose Vehicle (SPV) A separate legal entity created for one specific investment. When multiple investors want to co-invest alongside a fund in a particular deal, they often use an SPV. This structure keeps that investment separate from other activities and simplifies paperwork.
Syndicate Multiple investors pooling resources for a single opportunity. Instead of one investor writing a large check, several investors contribute smaller amounts. This model is gaining traction across African markets as it allows broader participation in larger deals.
Alternative Investment Fund (AIF) The umbrella term for funds investing outside traditional stocks, bonds, and cash. In African markets, this includes infrastructure debt funds, agriculture funds, real estate funds, and even entertainment financing vehicles.
Now, not all AIFs are created equal for African investors. However, funds domiciled in Mauritius or South Africa often offer better tax treaty networks, while Luxembourg-domiciled funds might have superior investor protections but higher compliance costs.
Capital and Cash Flow Terms
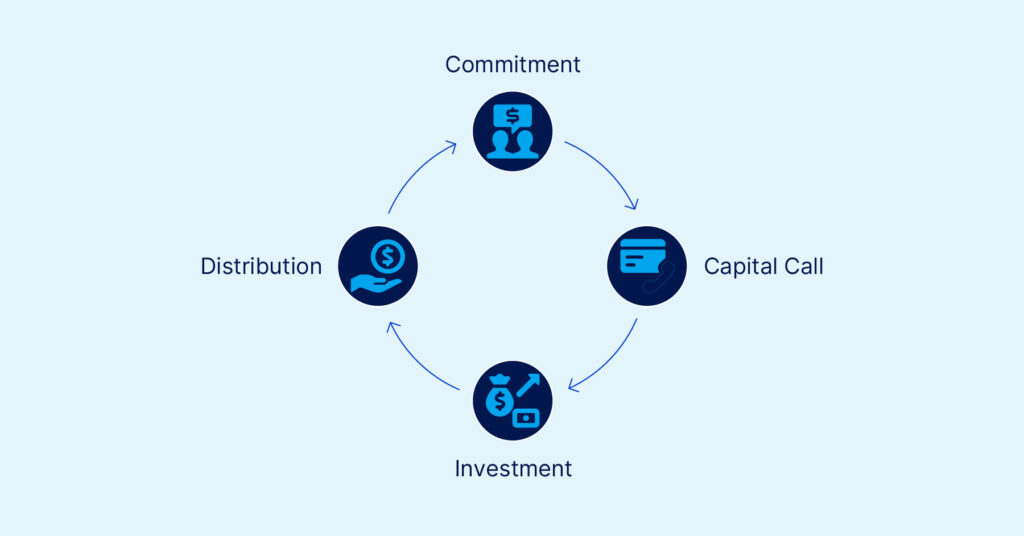
Understanding how money flows in alternative investments is crucial for African investors, especially given currency and liquidity considerations unique to emerging markets.
Capital Commitment vs Capital Call Your commitment is your total pledge to a fund; capital calls are when the fund actually requests payment. Committing $100,000 doesn’t mean writing a $100,000 check immediately. Funds typically call capital over 3-5 years as investment opportunities arise, giving you 10-30 days to transfer funds for each call.
Distribution Money returned to investors from profitable exits or ongoing cash flow. In African markets, distributions might come in local currency, creating additional currency risk considerations for investors.
The Performance Trinity: DPI, RVPI, TVPI
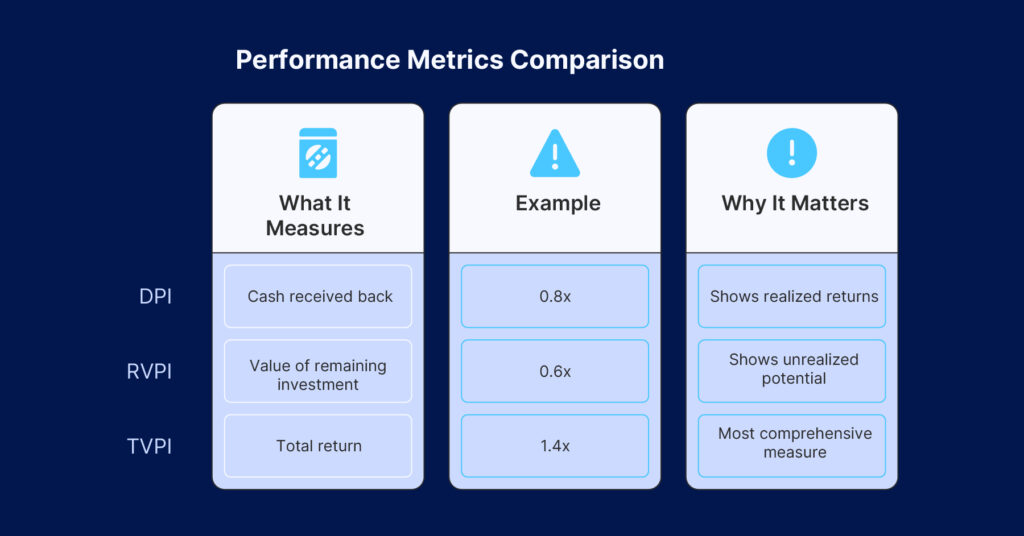
| Metric | What It Measures | Example | Why It Matters |
| DPI (Distributions to Paid-In) | Cash actually received back | $80k received ÷ $100k invested = 0.8x | Shows realized returns |
| RVPI (Residual Value to Paid-In) | Current value of remaining investment | $60k current value ÷ $100k invested = 0.6x | Shows unrealized potential |
| TVPI (Total Value to Paid-In) | DPI + RVPI = Total return | 0.8x + 0.6x = 1.4x total | Most comprehensive measure |
Understanding this trinity prevents common misunderstandings. A fund showing 2.3x TVPI with 0.8x DPI and 1.5x RVPI looks impressive on paper, but you’ve only received 80 cents for every dollar invested. The remaining 150 cents exists only on paper.
African investors should weigh DPI more heavily than global peers. Given longer exit cycles and higher deal failure rates, cash in hand beats paper valuations. Any fund showing less than 0.3x DPI after five years deserves serious scrutiny.
Performance and Risk Metrics
IRR vs MOIC: The Critical Difference The performance gap between global and African alternative investments is significant. While global private equity averages 14-15% IRR, African private equity median net IRRs are closer to 5 percent – a gap often obscured in marketing materials.
IRR gets overrated, especially in African markets where exit timelines are longer due to less liquid markets. IRR rewards quick exits, but African investments often need time to mature. A fund might show impressive 25% IRR by returning capital early through dividends while total value creation remains modest.
MOIC (Multiple on Invested Capital) tells a cleaner story. If you invest $100,000 and receive $250,000 over any timeframe, that’s 2.5x MOIC – simple, transparent, and unaffected by timing manipulation.
The African Currency Conundrum Here’s what most performance discussions miss: currency hedging can destroy African alternative investment returns. A 2024 analysis of African-focused funds showed that USD-hedged strategies underperformed unhedged equivalents by an average of 3.2% annually over five-year periods. The hedging costs – typically 2-4% per year – often exceed the volatility reduction benefits.
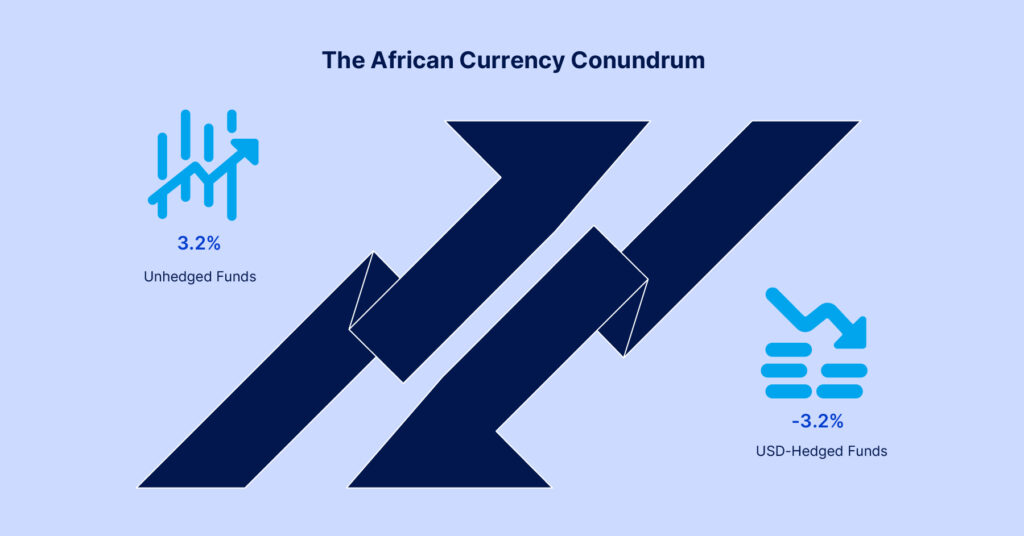
For African investors, unhedged exposure to hard currency alternatives often provides better risk-adjusted returns than expensive hedging strategies. The key is sizing positions appropriately rather than eliminating currency risk entirely.
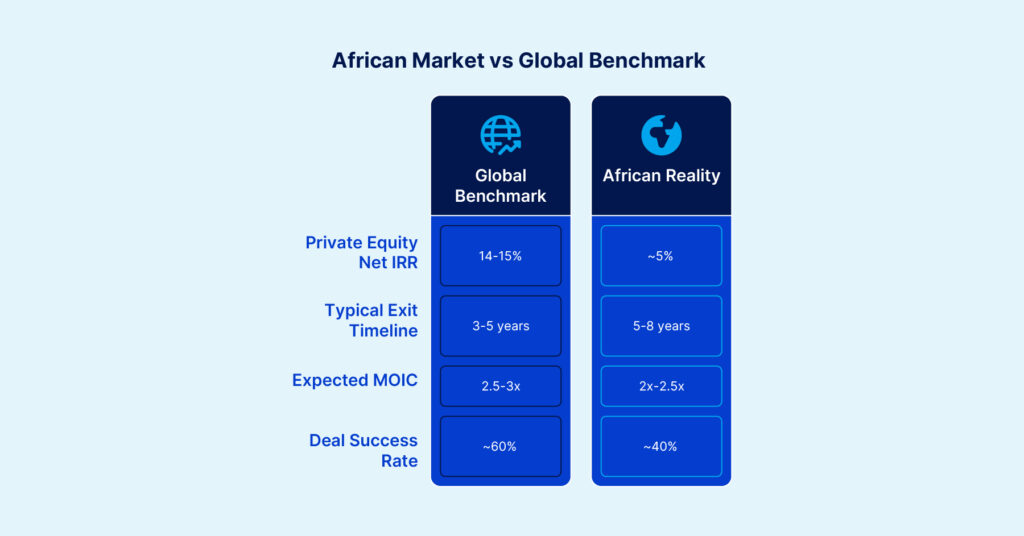
African Market Reality Check
| Performance Metric | Global Benchmark | African Reality | Key Difference |
| Private Equity Net IRR | 14-15% | ~5% | Fees and currency impact |
| Typical Exit Timeline | 3-5 years | 5-8 years | Less liquid exit markets |
| Expected MOIC | 2.5-3x | 2x-2.5x | Higher risk, lower multiples |
| Deal Success Rate | ~60% | ~40% | More deals fail completely |
Risk-Adjusted Metrics
- Standard Deviation: Measures volatility. African investments typically show higher standard deviation than developed markets
- Sharpe Ratio: Risk-adjusted returns (excess return ÷ standard deviation). Above 1.0 is good; above 1.5 is excellent
- Maximum Drawdown: Largest peak-to-trough decline. Expect higher drawdowns in African alternatives due to market volatility
The Misleading Metrics Problem Standard risk metrics often fail African investors because they assume normal return distributions. African markets exhibit higher kurtosis (fat tails) and skewness than developed markets, making Sharpe ratios less reliable indicators of actual risk.
African investors should supplement traditional risk metrics with downside deviation and maximum drawdown analysis. These measures better capture the asymmetric risk profiles common in emerging market alternatives.
Real Assets and Credit
Real Estate Metrics
- Cap Rate: Annual net income ÷ property value. Varies significantly across African markets – Johannesburg Grade A offices might trade at 8-10% while Lagos equivalents show 12-15%
- Loan-to-Value (LTV): Debt ÷ asset value. African lenders typically offer 60-70% LTV versus 80% in developed markets
- Debt Service Coverage Ratio (DSCR): Cash flow ÷ debt payments. Target 1.5x+ in African markets versus 1.25x globally due to higher volatility
Credit Classifications
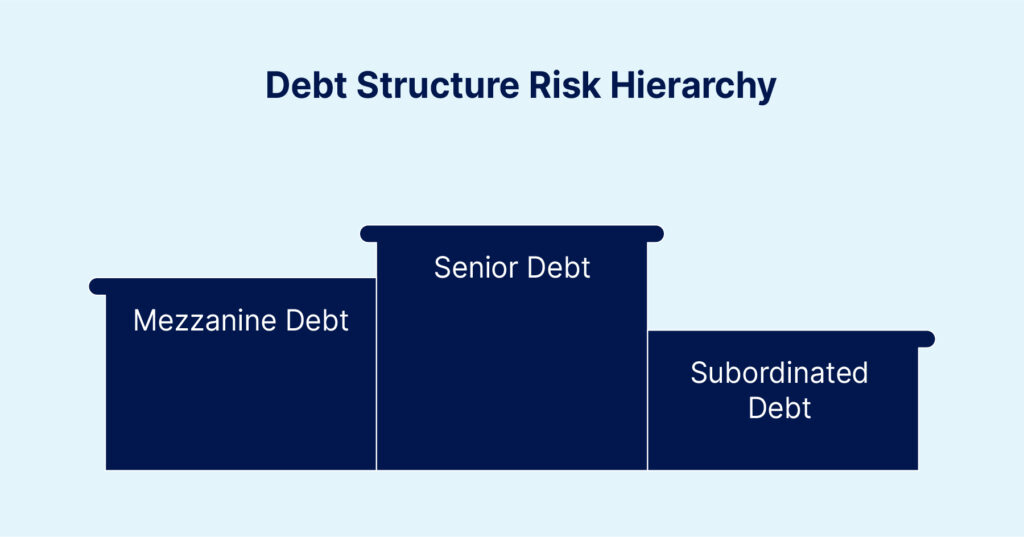
- Senior Debt: First claim on assets and cash flow, lower returns but lower risk
- Mezzanine Debt: Higher risk than senior debt, often includes equity upside through warrants or conversion features
- Subordinated Debt: Last to be paid, highest risk within debt structures
The African Credit Reality: African credit markets operate differently from developed markets. Local banks often lack appetite for long-term financing, creating opportunities for alternative credit providers. However, recovery rates on defaulted debt average just 25-30% compared to 60-70% in developed markets.
In African markets, the gap between senior and mezzanine debt returns often doesn’t justify the additional risk. Senior debt at 12-15% often provides better risk-adjusted returns than mezzanine at 18-22%.
Due Diligence Terms
Track Record Analysis:
Beyond historical returns, African market due diligence requires examining:
- Crisis management (2020 COVID response, currency devaluations)
- Regulatory navigation experience
- Local relationship networks
- Exit execution capabilities in less liquid markets
Governance and Alignment Terms
- Key-Man Provision: Protection if critical personnel leave. Essential in relationship-driven African markets
- Carried Interest: Manager’s share of profits, typically 20% above hurdle rate
- Hurdle Rate: Minimum return investors receive before managers earn carried interest
- High Water Mark: Ensures managers only earn performance fees after recovering previous losses
- Clawback: Provision requiring managers to return excess fees if later performance disappoints
Fee Structure Components
- Management Fee: Annual fee (typically 2% of committed capital) covering operational costs
- Performance Fee: Share of profits above hurdle rate
- Transaction Fees: Charges for deal sourcing and execution
- Monitoring Fees: Ongoing portfolio company oversight charges
The Fee Stack Problem: African alternative investment fees often exceed global benchmarks due to smaller fund sizes and higher operational costs. The median African private equity fund charges 2.5% management fees plus 22% carried interest, compared to 2%/20% globally. When combined with underlying portfolio company fees, total fee burdens can reach 4-5% annually.
Fee negotiation matters more in African alternatives due to the compressed return environment. A 0.5% reduction in management fees can improve net returns by 10-15% over a fund’s life.
Compliance and Regulatory Terms
Investor Classification
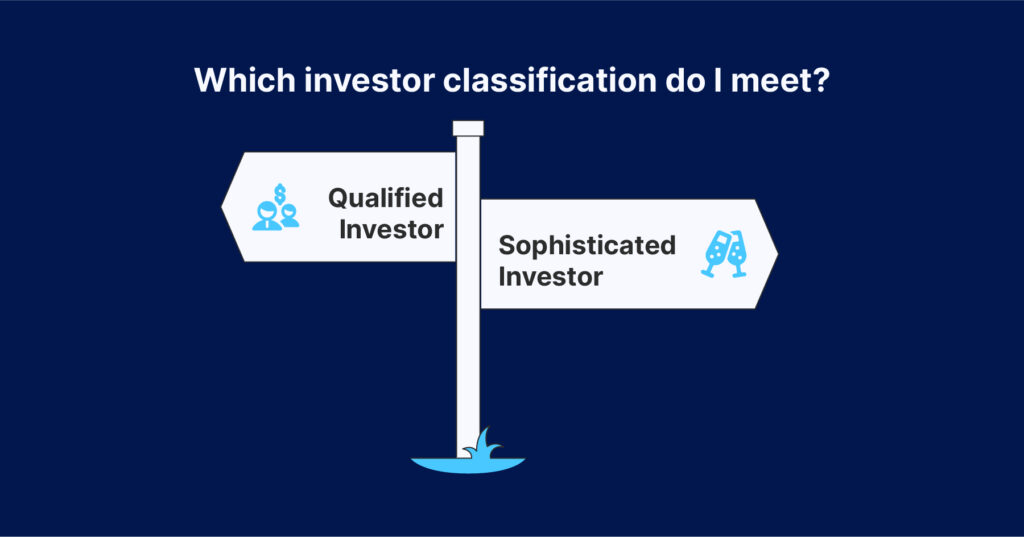
- Qualified Investor: Meets minimum wealth or income thresholds for alternative investments. Requirements vary by African jurisdiction
- Sophisticated Investor: Demonstrates investment knowledge and experience beyond basic qualifications
Compliance Requirements
- Know Your Customer (KYC): Identity and source of funds verification
- Anti-Money Laundering (AML): Procedures ensuring legitimate fund sources
- Suitability Assessment: Evaluation of investment appropriateness for individual circumstances
Digital Assets: Emerging Alternative Investment Terms
As African financial technology advances, digital assets increasingly appear in alternative investment discussions:
Core Digital Asset Terms
- Custody: Secure storage of digital assets. Unlike traditional assets, losing private keys means permanent loss
- Tokenization: Converting real-world assets into blockchain-based digital tokens
- Smart Contract Risk: Possibility that governing code contains vulnerabilities or bugs
- Stablecoin: Cryptocurrencies designed to maintain stable value, often pegged to major currencies
African Investor’s Term Prioritization Framework
Not all alternative investment terms matter equally for African investors. Use this decision tree to focus your learning:
Tier 1 (Master First):
- IRR vs MOIC interpretation
- DPI tracking and timing
- Currency exposure documentation
- Fee waterfall mechanics
- Exit timeline assumptions
Tier 2 (Important for Due Diligence):
- Track record analysis frameworks
- Regulatory jurisdiction implications
- Capital call predictability
- Distribution reinvestment options
Tier 3 (Advanced Optimization):
- Tax treaty structure benefits
- Co-investment rights mechanics
- Secondary market liquidity options
- ESG reporting requirements
Decision Checkpoints:
- Can you calculate net returns after all fees and currency impacts?
- Do you understand when and how you’ll receive distributions?
- Are you comfortable with the fund’s exit assumptions for your market?
- Have you stress-tested the investment under adverse currency scenarios?
Red Flag Terms (Walk Away If You See These):
- “Guaranteed returns” in any African market context
- Management fees above 3% without compelling justification
- Carry rates above 25% for first-time fund managers
- Lock-up periods exceeding 10 years without interim liquidity options
Frequently Asked Questions
Which alternative investment terms should African beginners prioritize?
Focus on the “essential six”: IRR, MOIC, DPI, capital call, distribution, and track record. These key concepts will help evaluate 90% of opportunities. Master these before tackling complex performance metrics like Sharpe ratios or detailed due diligence terms like waterfall structures.
How should African investors interpret IRR versus MOIC?
Both metrics matter, but MOIC often provides clearer insight for African investments. IRR can be manipulated through timing, while MOIC shows straightforward value creation. For African alternatives with longer exit timelines, MOIC gives a more honest picture of actual wealth creation.
What makes alternative investment terminology different in African markets?
The terms remain universal, but application differs significantly. Performance metrics must account for currency volatility, due diligence emphasizes political and regulatory risks, and liquidity premiums are typically higher than developed markets. Correlation patterns between African assets and global markets can shift dramatically during crisis periods.
Why do African alternative investments show lower returns than global benchmarks?
The conventional answer focuses on market maturity and deal flow. But the real culprit is often fee stacking and currency hedging costs. A 2024 study found that after accounting for management fees (2.5% vs 2.0% globally), carried interest (22% vs 20%), and hedging costs (2-4% annually), the “return gap” between African and global alternatives narrows significantly.
The structural challenges remain real: smaller deal sizes limit economies of scale, exit markets are less liquid, and regulatory complexity adds costs. However, currency depreciation often provides a natural hedge for African investors, while global investors require expensive protection.
The performance gap between African and global alternatives is overstated when measured in local currency terms for local investors. The real question isn’t why African returns are lower, but whether the risk-return profile matches African investor needs.
Alternative investments carry significant risks, including total loss of capital, illiquidity, and lack of transparency. Past performance does not guarantee future results. Currency fluctuations may significantly impact returns for African investors. Always consult qualified advisors familiar with your jurisdiction and circumstances before making investment decisions.